Welcome to the beginning of your journey into the world of data analysis with Power BI Service!
Whether you’re a seasoned data analyst or just dipping your toes into the vast ocean of business intelligence, Power BI service offer a flexible and comprehensive platform that can transform raw data into insightful, actionable information.
This friendly step-by-step guide is designed to help you understand the basics and get you up and running with Power BI.
So, grab a cup of coffee, and let’s take the first step into the exciting world of data visualisation with Power BI!
Understanding Power BI Service
Power BI is a fascinating tool in the ever-evolving landscape of data analysis and business intelligence.
But before diving into how to get started with Power BI Service, let’s ensure we’re on the same page about what Power BI actually is and why it’s so highly regarded in the world of data visualisation and business strategy.
What is Power BI?
Power BI is a suite of business analytics tools that Microsoft offers, designed to help individuals and organisations analyse data and share insights through beautiful, interactive visualisations.
It’s part of the broader Microsoft Power Platform, which includes various tools for automating workflows and creating custom business applications.
But Power BI specifically shines in its ability to pull data from a wide variety of sources, transform it, and then present it in a user-friendly manner.
Whether you’re a data analyst, a business manager, or just someone curious about the insights your data can offer, Power BI is designed to make data analysis more accessible and insightful.
Key Features of Power BI Service
Understanding the key features of Power BI Service is like getting to know the superpowers of your favourite superhero you need to know what it’s capable of to use it effectively. Some of the standout features include:
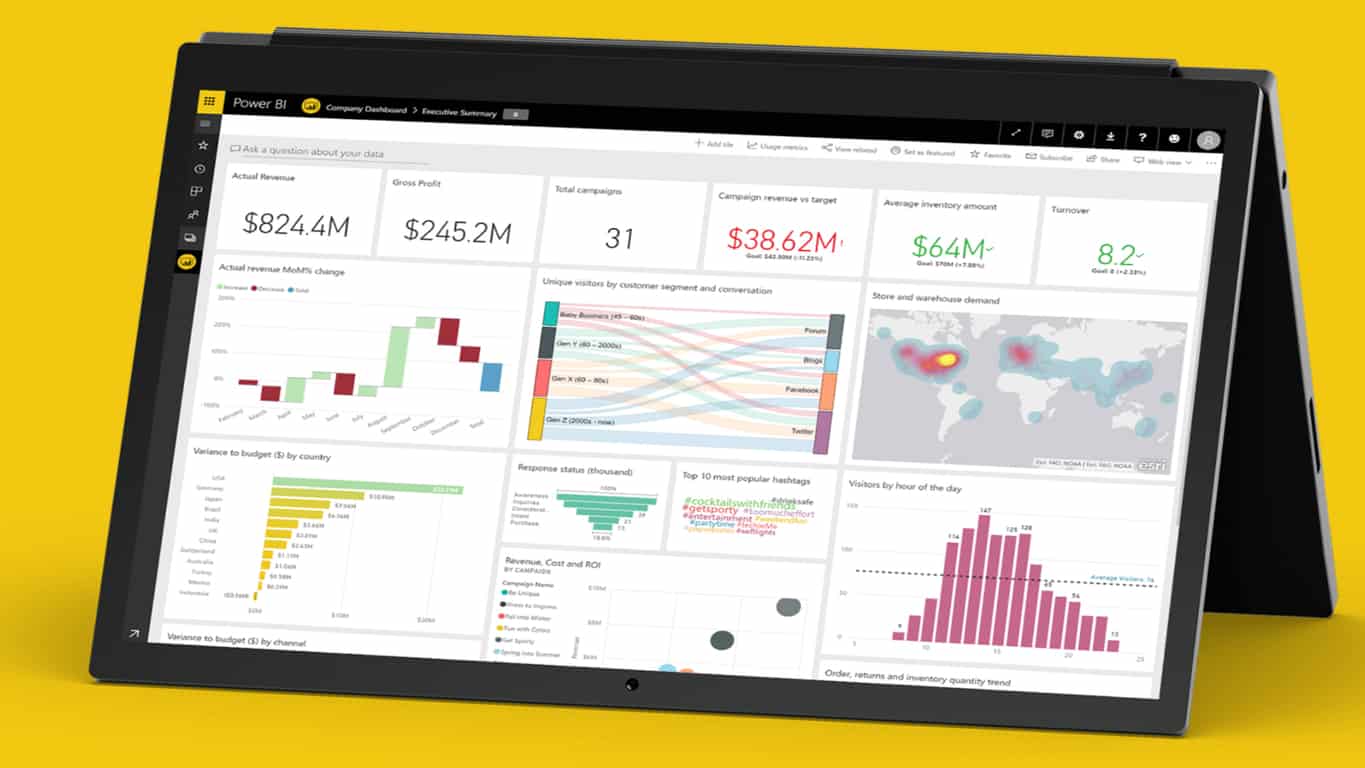
Real-Time Dashboards: Power BI Service allows you to create dashboards that update in real time, providing the most current insights possible.
– Interactive Reports: Beyond static reports, Power BI’s reports are interactive, allowing users to drill down into the details or adjust what data they’re viewing.
– Wide Range of Data Connectors: Power BI connects to a vast array of data sources, including Excel spreadsheets, databases, and cloud services, making it versatile.
– Collaboration Tools: It integrates well with other Microsoft products, like Teams and Excel, making sharing and collaboration easy.
– AI Capabilities: Power BI incorporates AI technology, offering advanced data analysis and insight generation.
Getting Started with Power BI Service
Now that you understand what Power BI is and its key features, you’re likely itching to get started. Let’s walk through the initial steps to get you up and running with Power BI Service.
Signing Up for the Power BI Service
Getting started with Power BI Service is surprisingly straightforward. You’ll need to go to the Power BI website and sign up for an account.
You can start with a free account, which offers a generous array of features, perfect for individuals or small teams just getting started. For more advanced features, there are various paid plans available.
You’ll need a work or school email address to sign up, as Power BI doesn’t support sign-ups with personal email addresses.
Navigating the Power BI Dashboard
Once you’ve signed up, you’ll be taken to the Power BI dashboard, which might be overwhelming at first glance. But don’t worry; it’s quite user-friendly once you get the hang of it. The main areas you’ll want to familiarise yourself with are:
– Home: Your primary starting point, where you can access recent and pinned reports, dashboards, and apps.
– Reports: Here’s where you’ll find individual reports that you’ve created or that have been shared with you.
– Dashboards: These are collections of visuals from various reports, giving an at-a-glance view of key metrics and trends.
– Datasets: The datasets are your raw data that’s been imported into Power BI for analysis.
Spend some time clicking through these areas to get a feel for where everything is. The best way to learn is by doing, so don’t be afraid to explore.
Exploring Data Sources
One of Power BI’s strengths is its ability to connect to various data sources. This might include cloud services like Microsoft Azure or tools like Salesforce, Google Analytics, etc. To get started with exploring your own data:
– Navigate to the “Get Data” section in Power BI.
– You’ll see a list of possible data sources. Select the one that corresponds with where your data is stored.
– Follow the prompts to connect your data. This might involve logging into your account for that service or providing a server address for databases.
Once your data is connected, you’re ready to start transforming it into visual insights. You’ll likely spend a significant amount of time here, experimenting with different sources and seeing what insights you can uncover.
Creating Your First Report
Creating your first report in Power BI Service is like painting on a blank canvas, but instead of colours, you’ll be using data to tell a story. The process is straightforward, and with a bit of practice, it becomes a smooth and intuitive experience.
Importing Data into Power BI
Before you can start crafting your masterpiece, you need to get your data into Power BI. The process is user-friendly:
- Click on “Get Data” on your Power BI Service homepage.
- Select the source of your data. Power BI can connect to a wide range of data sources, from Excel spreadsheets to databases and cloud services.
- Navigate through the prompts to connect your data source and import the data into Power BI. Depending on the source, you might need to enter credentials or select specific tables.
Remember, the quality and organisation of your data significantly impact the insights you can derive. So, it pays to ensure your data is clean and well-structured before importing.
Building Visualisations
With your data imported, it’s time to bring it to life through visualisations:
– Start by selecting the “Report” view in Power BI.
– Drag and drop fields from your dataset into the report canvas.
– Choose the type of visualisation that best represents your data from the visualisations pane. You can experiment with bar charts, line graphs, pie charts, or even maps and scatter plots.
– Customise your visualisation by adding filters, changing colours, and adjusting labels to make it more informative and compelling.
Building effective visualisations is an art and science, requiring you to balance aesthetics with functionality. The goal is to make your data easy to understand and engaging.
Adding Insights and Analysis
The real power of Power BI comes from its ability to help you add insights and analysis to your report:
– Utilise the “Analytics” pane to add trend lines or forecasts to your charts.
– Explore the “Insights” feature to automatically find patterns, trends, and outliers in your data.
– Use the Q&A feature to ask natural language questions about your data and get visual responses.
This is where your data begins to narrate its story, revealing trends, behaviours, and opportunities hidden within.
Sharing Insights with Power BI Service
Once your report is ready, Power BI Service offers robust features to share these insights, collaborate with colleagues, and ensure your data stays up to date.
Collaborating with Colleagues
Power BI makes teamwork easy. You can:
– Share your reports and dashboards directly with colleagues or through groups.
– Work together in real time, making collective adjustments and annotations.
– Set up access permissions to control who can view or edit your reports.
This collaboration feature ensures that your team is always on the same page, making data-driven decisions together.
Publishing Reports and Dashboards
Sharing your insights is as simple as clicking the “Publish” button:
- Choose whether you want to publish a report or a dashboard.
- Select the workspace where you want to publish.
- Share the link with your team or stakeholders.
By publishing your reports and dashboards, you’re essentially democratising data within your organisation, allowing everyone to make informed decisions based on the latest insights.
Setting up Data Refresh Schedules
To keep your reports relevant and accurate, Power BI allows you to set up automatic data refresh schedules:
– Go to the dataset settings in Power BI Service.
– Specify how frequently you want the data to refresh — daily, weekly, or more frequently.
– Configure any necessary credentials or connections for automatic refreshes.
By ensuring your data is always up to date, you maintain the reliability and usefulness of your reports and dashboards. This step is crucial for businesses that rely on timely data to monitor performance and make strategic decisions.
Advanced Features and Tips
Exploring the advanced features of Power BI Service can significantly enhance your data analysis and visualisation projects. Once you’ve got a handle on the basics, it’s time to dive deeper into what Power BI can offer.
Creating Calculated Columns and Measures
Calculated columns and measures are powerful tools in Power BI that allow you to perform calculations on your data directly within your reports.
Calculated columns are useful when you need to add new data to a table based on existing data. For instance, you could create a calculated column to combine first and last names into a full name column.
On the other hand, measures are used for calculations that aggregate data, like sums or averages, which are recalculated as your data changes.
This dynamic calculation makes measures perfect for creating totals, averages, and other summarised data. Both calculated columns and measures use DAX (Data Analysis Expressions), a formula language designed for data analysis.
Using Custom Visuals
Power BI allows you to import custom visuals to make your reports stand out or better match your data visualisation needs.
These visuals can range from advanced chart types not found within the default selections to completely custom visuals developed for specific industries. You can find these in the Power BI Visuals Marketplace.
Custom visuals add a layer of personalisation and can help convey your data story more effectively. Just remember, while custom visuals can be incredibly powerful, they should be used judently to keep your reports navigable and user-friendly.
Optimising Performance and Efficiency
As your Power BI reports become more complex, you might notice a change in performance. Here are a few tips to keep your reports running smoothly:
– Minimise the use of calculated columns. While they’re useful, calculated columns can slow down your reports. Use them sparingly and consider using measures instead when possible.
– Optimise your data model. Try to keep your data model as simple and streamlined as possible. The more complex your data model, the slower your reports may load.
– Use filters wisely. Filters are great for narrowing down your data, but too many filters or overly complex filters can reduce performance.
By leveraging the advanced features in Power BI and implementing these tips, you can take your data analysis and reports to the next level, all while maintaining efficiency and performance.
Conclusion
Congratulations! If you’ve followed this guide from the beginning, you’re now well on your way to becoming proficient with Power BI Service. Remember, diving into data analysis and visualisation is a journey. The more you use Power BI, the more insights and benefits you’ll discover for your business or projects.
Remember, data is powerful, but making it work for you involves continuous learning and experimentation.
Get Power BI Service from IVE Data-Driven today for the results you are seeking! With us, you can Keep exploring, analysing, and, above all, visualising your data in new and insightful ways.